BrainSense advanced Dashboard
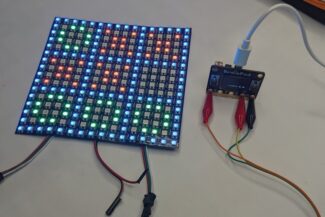
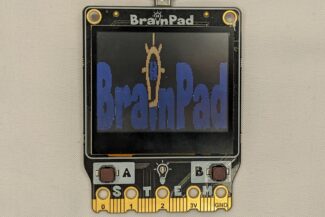
In this lesson, we aim to advance the representation and visualization of our sensor data through the colorful graphic BrainPad Rave LCD screen.
Prerequisite
It’s essential to learn the programming of all sensors and modules in the BrainSense kit, outlined comprehensively in the BrainSense modules. Alternatively, you can refer to the BrainSense Demo for a complete walkthrough.
Drawing Dynamic Bar Chart
The bar design should comprise three rectangles: the first, a constant and solid representation outlining the overall shape of the bar; the second, representing the background of the bar when it’s empty; and the third, situated within the boundaries of the first and positioned above the second, dynamically adjusts in width based on sensor values. With values ranging from 0 to 100, the width of the third rectangle precisely mirrors the sensor value within this range.
Let’s take the Steam sensor, for instance, and begin by rendering its name as a label with a green color on the BrainPad Rave LCD by this: LcdTextS("text", color, x, y, scaleWidth, scaleHeight)
@Loop
    LcdClear(0)
    s=ARead(5)      # Steam Sensor
    RaLCD()
    LcdShow()
Goto Loop

@RaLCD

    y=35
    x=5
    # drawing the data lables
    LcdTextS("STEAM= ", 0x00ff00, x, y,1,2)
Return
Following this, we proceed to draw the two filled rectangles—the white boundaries and the black background—forming the foundational structure of the bar by LcdFill(color, x, y, width, height).
@Loop
    LcdClear(0)
    s=ARead(5)      # Steam Sensor
    RaLCD()
    LcdShow()
Goto Loop

@RaLCD

    y=35
    x=5
    # drawing the data lables
    LcdTextS("STEAM= ", 0x00ff00, x, y,1,2)

    w=103
    h=12
    y=36
    x=42

    # drawing the white and black rectangles
    LcdFill(0xffffff,x,y,w,h)
    LcdFill(0x000000,x+2,y+2,w-4,h-4)
Return
Lastly, we draw the third rectangle, representing the sensor value as the width of the rectangle within the range of 0 to 100.
We are positioned above the black rectangle, surrounded by the white boundaries, providing a visual representation of the sensor value on the BrainPad Rave LCD.
@Loop
LcdClear(0)
s=ARead(5) # Steam Sensor
RaLCD()
LcdShow()
Goto Loop
@RaLCD
y=35
x=5
# drawing the data lables
LcdTextS("STEAM= ", 0x00ff00, x, y,1,2)
w=103
h=12
y=36
x=42
# drawing the white and black rectangles
LcdFill(0xffffff,x,y,w,h)
LcdFill(0x000000,x+2,y+2,w-4,h-4)
x=44
y=38
h=8
# drawing the bars based on sensors values
LcdFill(0xf08000,x,y,s,h)
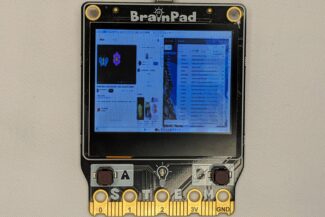
ReturnFinally, let’s extend the design to accommodate three dynamic bars for the Steam, Light, and Soil Moisture sensors. Additionally, we can display the Temperature and Humidity sensor values as numeric data at the bottom of the screen on the BrainPad Rave LCD.
This comprehensive visualization will offer a quick and insightful overview of multiple sensor readings simultaneously.
@Loop
    LcdClear(0)
    s=ARead(5)      # Steam Sensor
    t=Temp(6,11)    # Temperature Sensor
    u=Humidity(6,11)# Humidity Sensor
    p=Aread(0)      # photoresistance
    g=Aread(1)      # Moisture Sensor
    RaLCD()
    LcdShow()
Goto Loop

@RaLCD
    LcdTextS("BrainSense",0xf08000,20,10,2,2)

    y=35
    x=5
    # drawing the data lables
    LcdTextS("STEAM= ", 0x00ff00, x, y,1,2)
    LcdTextS("LIGHT= ", 0x00ff00, x, y+20,1,2)
    LcdTextS("SOIL = ", 0x00ff00, x, y+40,1,2)
    LcdText("Celsius= ", 0xff00ff, x+40, y+60):LcdText(str(t), 0xff00ff, x+100, y+60)
    LcdText("Humidity= ", 0x0000ff, x+40, y+70):LcdText(str(u), 0x0000ff, x+100, y+70)

    w=103
    h=12
    y=36
    x=42
    # drawing the white rectangles
    for n=0 to 2
        LcdFill(0xffffff,x,y,w,h)
        LcdFill(0x000000,x+2,y+2,w-4,h-4)
        y=y+20
    Next

    x=44
    y=38
    h=8
    # drawing the bars based on sensors values
    LcdFill(0xf08000,x,y,s,h)
    LcdFill(0xf08000,x,y+20,p,h)
    LcdFill(0xf08000,x,y+40,g,h)
Return
Smart Home Full Demo with Dynamic Dashboard
Let’s revisit the previous lesson where we wrote a full demo of BrainSense with BrainPad Pulse and we need to seamlessly transition it to the BrainPad Rave. We’ll integrate the new dashboard featuring dynamic bars.
Since we employed Screen instructions as Subroutines, akin to methods and functions, we can write both subroutines for Pulse and Rave actions. In the main loop, we’ll call the appropriate method (line 41) based on the microcomputer, ensuring compatibility with both BrainSense devices.
####### OUTPUTS #######
### MOTOTRS ###
# Servo PIN 10
# Fan PIN 11

### LIGHTS ####
# RGB LEds PIN 12

### SOUNDS ###
# horn PIN 13

####### INPUTS #######
### SENSORS ###
# PIR   PIN 3
# Flame PIN 4
# STEAM PIN 5
# Humid PIN 6
# Photo PIN 0
# Soil  PIN 1

LcdClear(1)
NeoClear()
y=0
x=0
h = 120
w = 160

@Loop
    NeoClear()
    LcdClear(0)

    m=DRead(3,1)    # PIR Sensor
    f=DRead(4,1)    # Flame Sensor
    s=ARead(5)      # Steam Sensor
    t=Temp(6,11)    # Temperature Sensor
    u=Humidity(6,11)# Humidity Sensor
    p=Aread(0)      # photoresistance
    g=Aread(1)      # Moisture Sensor
    AWrite(11,0)    # DC motor

    RaLCD()

    Move()
    Steam()
    Flame()
    Light()
    Soil()

    LcdShow()
    NeoShow(12,4)
Goto Loop

@Move
    If m=0:ServoSet(10,0):End
    If m=1:ServoSet(10,90):End
Return

@Steam
    If s>70
        Awrite(11,50)
        NeoSet(0, 0, 0, 255)
        NeoSet(1, 0, 0, 255)
        NeoSet(2, 0, 0, 255)
        NeoSet(3, 0, 0, 255)
        NeoShow(12,4)
    End
Return

@Flame
    If f=0
        ServoSet(10,90)
        For n=400 to 500 step 5
            Beep(13,n,20)
            NeoSet(0, 255, 0, 0)
            NeoSet(1, 0, 0, 255)
            NeoSet(2, 255, 0, 0)
            NeoSet(3, 0, 0, 255)
            NeoShow(12,4)
            Wait(20)
            NeoClear()
            NeoShow(12,4)
        Next
    End
Return

@Light
    If p<=85:
        NeoSet(0, 255, 200, 0)
        NeoSet(1, 255, 200, 0)
        NeoSet(2, 255, 200, 0)
        NeoSet(3, 255, 200, 0)
    End
Return

@Soil
    If g<30
        For x=100 to 150 step 50
            Beep(13,x,20)
            NeoSet(0, 255, 0, 255)
            NeoSet(1, 0, 255, 0)
            NeoSet(2, 255, 0, 255)
            NeoSet(3, 0, 255,0)
            NeoShow(12,4)
            wait(20)
            NeoClear()
            NeoShow(12,4)
        Next
    End
Return

@RaLCD

    LcdTextS("BrainSense",0xf08000,20,10,2,2)

    y=35
    x=5
    # drawing the data lables
    LcdTextS("STEAM= ", 0x00ff00, x, y,1,2)
    LcdTextS("LIGHT= ", 0x00ff00, x, y+20,1,2)
    LcdTextS("SOIL = ", 0x00ff00, x, y+40,1,2)
    LcdText("Celsius= ", 0xff00ff, x+40, y+60):LcdText(str(t), 0xff00ff, x+100, y+60)
    LcdText("Humidity= ", 0x0000ff, x+40, y+70):LcdText(str(u), 0x0000ff, x+100, y+70)

    w=103
    h=12
    y=36
    x=42

    # drawing the white rectangles
    for n=0 to 2
        LcdFill(0xffffff,x,y,w,h)
        LcdFill(0x000000,x+2,y+2,w-4,h-4)
        y=y+20
    Next

    x=44
    y=38
    h=8

    # drawing the bars based on sensors values
    LcdFill(0xf08000,x,y,s,h)
    LcdFill(0xf08000,x,y+20,p,h)
    LcdFill(0xf08000,x,y+40,g,h)
Return

@PuLCD
    LcdTextS("BrainSense",1,3,0,2,1)

    y=15
    x=5
    # drawing the lables with values
    LcdText("STEAM= ", 1, x, y):LcdText(str(s), 1, x+60, y)
    LcdText("LIGHT= ", 1, x, y+10):LcdText(str(p), 1, x+60, y+10)
    LcdText("SOIL= ", 1, x, y+20):LcdText(str(g), 1, x+60, y+20)
    LcdText("Celsius= ", 1, x, y+30):LcdText(str(t), 1, x+60, y+30)
    LcdText("Humidity= ", 1, x, y+40):LcdText(str(u), 1, x+60, y+40)

Return
What’s Next?
let’s modify our data visualization to present the bars in a vertical orientation. This adjustment will provide a different visual perspective, allowing for a representation of the sensor data on the BrainPad Rave LCD.
BrainStorm
Certainly! With the touch capability of the BrainPad Rave LCD using the Touch API, we can design a dynamic and interactive dashboard for our smart home. Users can intuitively control and visualize data by incorporating touch-based controls.
For example, tapping on a specific area could toggle a device, change a setting, or provide more detailed information about a sensor. This interactive approach adds a layer of user-friendly functionality, enhancing the overall experience of managing and monitoring the smart home environment.